Seasonal Performance Patterns and Their Impact on Accumulator Strategies in Top European Football Leagues
Written by Katja Simon · Aug 20, 2026
Seasonal Performance Patterns and Their Impact on Accumulator Strategies in Top European Football Leagues
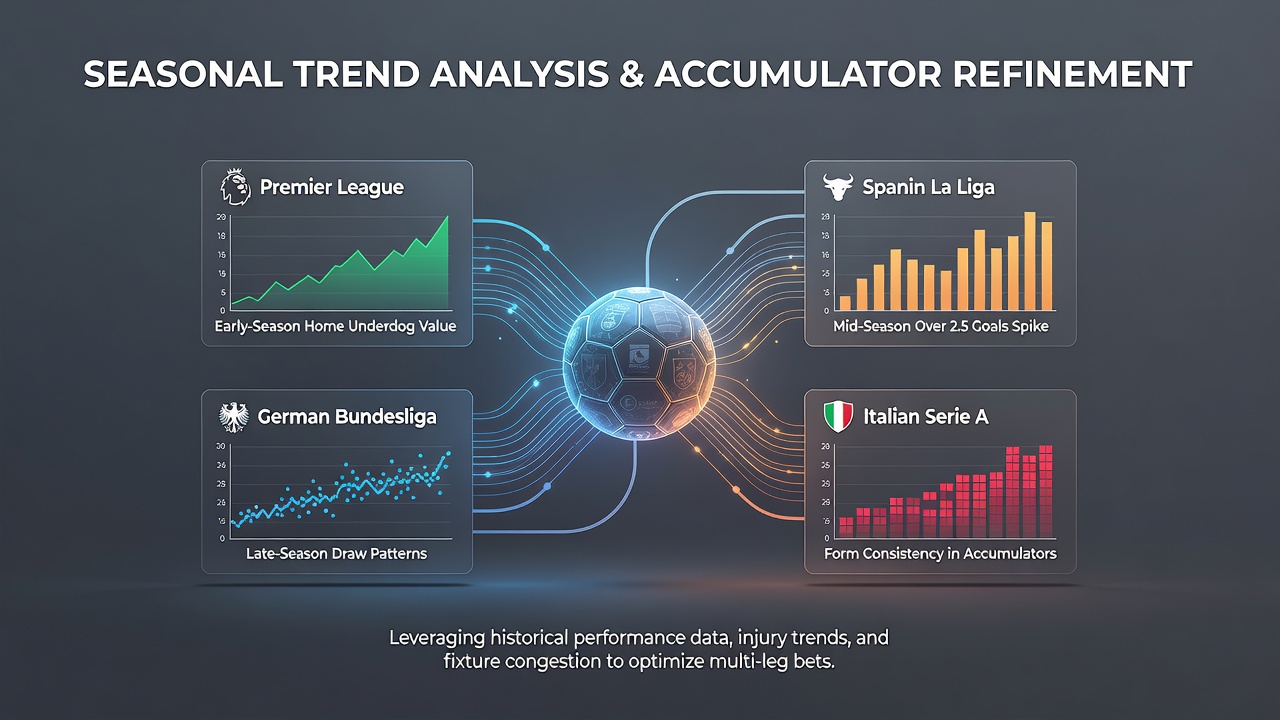
Seasonal trend analysis examines how team results shift across different months and phases of the campaign in leagues such as the Premier League, La Liga, Bundesliga, Serie A and Ligue 1, and observers apply those patterns when constructing accumulator selections. Data collected over multiple seasons shows that early August fixtures often produce higher scoring rates because pre-season schedules leave squads less settled, whereas December and January bring increased draws due to congested calendars and adverse weather conditions. Analysts compile these statistics from official match reports to adjust the legs they include in multi-bet wagers rather than relying on season-long averages alone.
Core Components of Seasonal Data Collection
Researchers gather match outcomes by month, home and away splits, goal tallies, and clean sheet percentages, then cross-reference them with fixture density and travel distances. In the Bundesliga, for instance, teams playing midweek European matches in September and October record fewer points per game in the following weekend round, a pattern confirmed across five consecutive seasons. Similar records from La Liga indicate that clubs from northern regions maintain stronger home records during the winter period when pitch conditions deteriorate more noticeably. Those compiling accumulator lists therefore filter selections to favour sides with proven records in specific calendar windows instead of selecting teams based solely on current league position.
Application Across Major Leagues
Each league exhibits distinct seasonal signatures that influence accumulator construction. Premier League data reveals elevated away win rates for mid-table sides during the opening three weeks of August, while Serie A statistics demonstrate a rise in low-scoring encounters after the winter break when defensive organisation returns to peak levels. Bundesliga observers note that high-pressing teams lose points more frequently in February and March because pitch wear reduces the effectiveness of intense pressing styles. Accumulator builders incorporate these league-specific filters so that a single bet slip might combine an early-season home favourite from England with a late-winter under from Italy, creating combinations grounded in documented monthly variances.

Integration With Accumulator Construction
Practitioners first identify the time window of upcoming fixtures and then apply historical filters to each potential leg. When August 2026 fixtures begin, analysts will compare early-season goal averages against the previous five campaigns to decide whether overs or unders appear more probable in opening rounds. They also track international break effects, noting that squads returning from national team duty in early September show measurable dips in performance metrics for the subsequent two domestic matches. This layered approach reduces reliance on form guides that ignore calendar context and instead builds selections around repeatable monthly tendencies.
External Data Sources and Verification
Figures from UEFA technical reports supply additional context on how European competition schedules intersect with domestic calendars, while studies published by the German Football League provide granular Bundesliga monthly breakdowns that extend back more than a decade. Cross-checking these independent datasets allows analysts to confirm whether a perceived trend holds across borders or remains league-specific. Such verification steps become especially relevant when constructing accumulators that span multiple countries because divergent scheduling rhythms can amplify or cancel individual seasonal effects.
Adjustments for Weather and Fixture Congestion
Weather records paired with performance data reveal that rainfall totals above seasonal norms correlate with fewer goals in northern leagues during November and February, prompting accumulator selectors to lean toward unders in those periods. Fixture congestion tables published by league administrations further highlight that teams contesting multiple competitions accumulate more draws between matchdays 12 and 18, a window when midweek travel intensifies. These combined indicators give bet constructors concrete criteria for excluding or including certain matches rather than depending on intuition or recent headlines.
Conclusion
Seasonal trend analysis supplies a structured framework that refines accumulator selections by replacing blanket assumptions with month-by-month performance records across Europe's leading soccer leagues. As new campaigns unfold, updated datasets continue to sharpen the accuracy of these filters, enabling selectors to align individual legs with documented historical tendencies rather than relying on generalised season averages.