Slot Machine Analytics: Decoding Hit Rates and Drought Lengths with Tracking Software
Written by Rafael Walter · Sep 24, 2026
Slot Machine Analytics: Decoding Hit Rates and Drought Lengths with Tracking Software
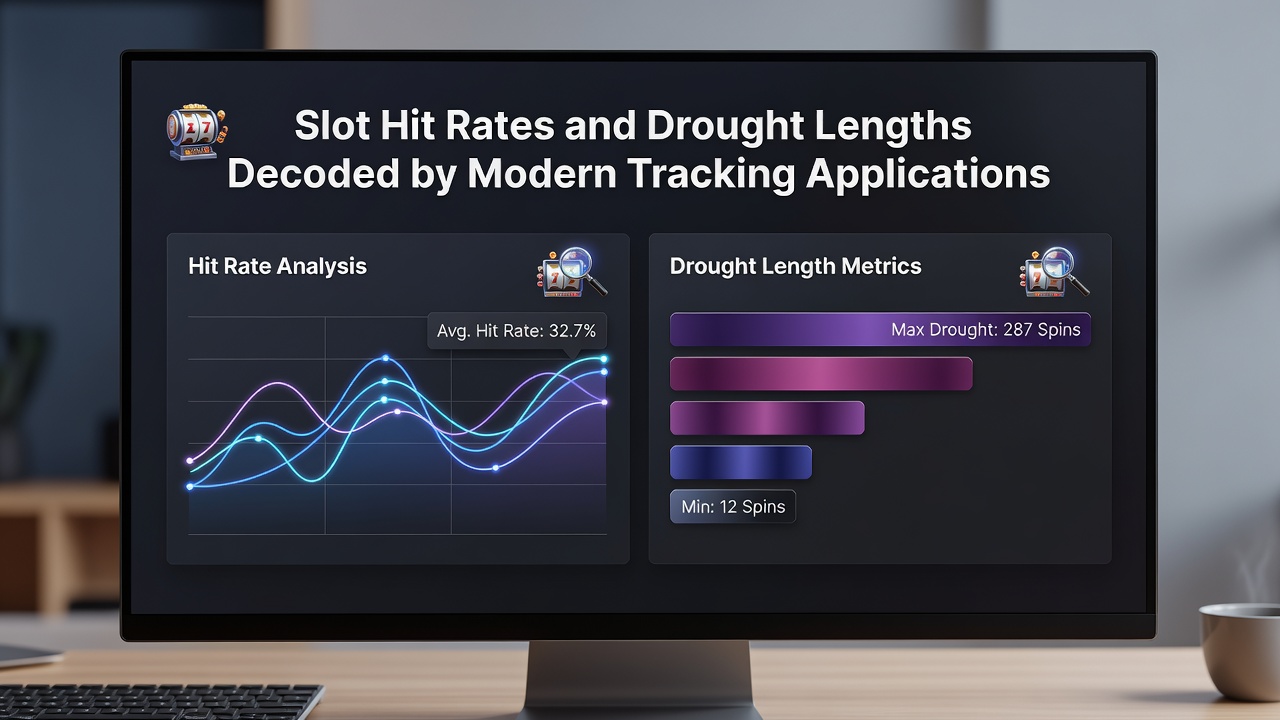
Modern tracking applications collect detailed session data from slot machines across online platforms and land-based venues, allowing analysts to calculate hit rates as the percentage of spins that produce any return while measuring drought lengths as consecutive spins without qualifying wins or bonus triggers. These tools aggregate thousands of individual player sessions into visual reports that highlight frequency patterns and extended dry periods common in high-volatility titles.
Core Metrics Captured by Tracking Tools
Hit rate calculations start with raw spin logs that record every outcome, including small line wins and scatter combinations, then divide successful spins by total spins played during a monitored period. Drought length tracking logs the longest streaks between payouts above a user-defined threshold, often set at 0.5 times the bet size or higher, and presents these intervals as histograms that show distribution across hundreds of sessions. Software developers update algorithms regularly to account for new game mechanics such as cascading reels or multiplier ladders introduced in titles released through 2026.
Data Sources and Regional Reporting Standards
Reports compiled by the Nevada Gaming Control Board supply baseline figures for physical slot floors that tracking apps compare against digital counterparts, while the Australian Institute of Criminology publishes independent volatility studies that developers reference when calibrating drought prediction models. Analysts cross-reference these public datasets with anonymized user uploads from tracking platforms to identify whether observed hit rates align with published return-to-player percentages across different game providers.
September 2026 saw several tracking applications release updated modules that incorporate live regulatory filings from multiple jurisdictions, enabling users to filter session data by jurisdiction-specific payout verification standards without requiring manual entry of game rules.
Practical Application in Session Analysis
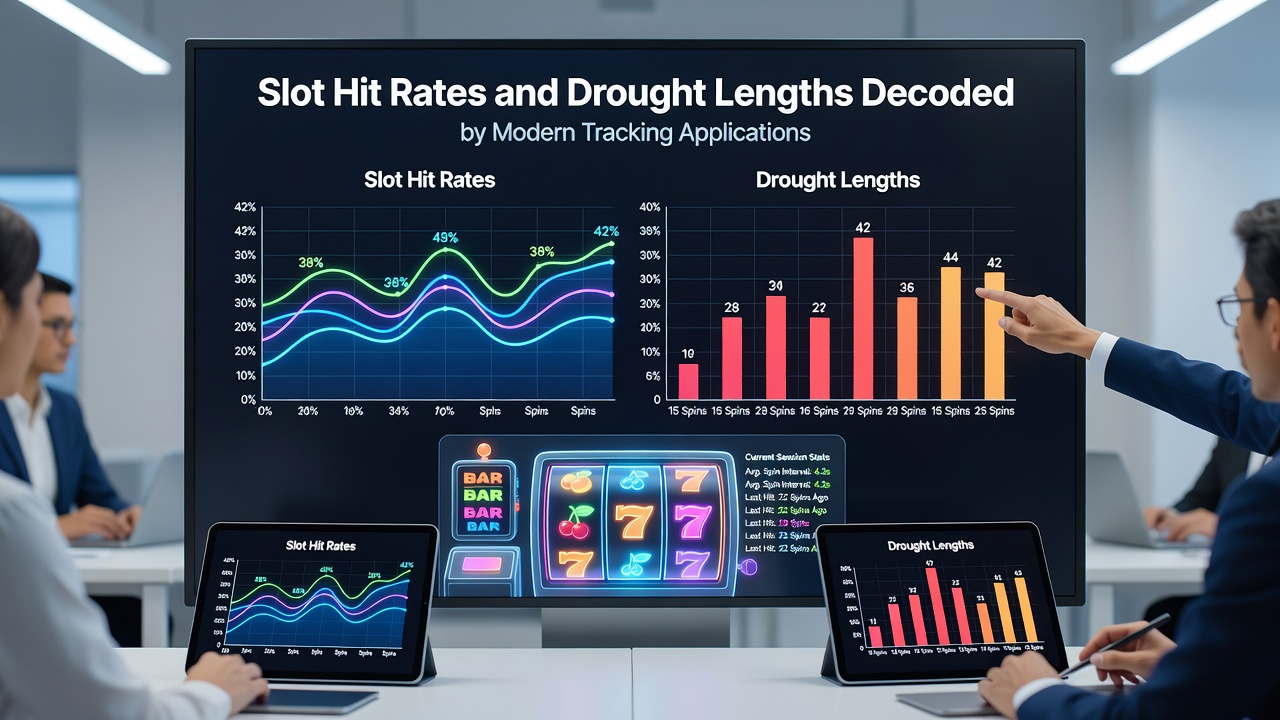
Users input bet size, game identifier, and session duration into tracking software that then generates real-time alerts when current drought length exceeds historical averages calculated from prior recorded play. One documented case involved a researcher who loaded three months of aggregated data into an analytics dashboard and observed that certain Megaways titles produced hit rates between 22 and 28 percent while maintaining average drought lengths of 47 spins between any return. Another study group compared land-based and remote sessions recorded during the same calendar quarter and noted that digital versions triggered bonus features at slightly higher frequencies, though maximum drought lengths remained comparable once sample sizes exceeded 50,000 spins.
Integration with Game Mathematics
Developers design tracking algorithms to separate base game hit rates from feature hit rates, recognizing that many modern slots deliver the majority of returns through free spin rounds or pick-and-click bonuses rather than regular reel combinations. The separation allows users to view drought statistics specific to bonus triggers, which often exhibit longer intervals than line-hit droughts because bonus symbols appear at lower probabilities. Software interfaces present these layered statistics through color-coded timelines that make extended dry periods visually distinct from normal variance fluctuations.
Limitations and Verification Practices
Tracking applications rely on user-provided data integrity, so analysts recommend cross-checking imported session logs against casino-provided history pages before drawing conclusions about individual game performance. External verification through academic sources such as peer-reviewed papers hosted by the University of Nevada, Las Vegas International Gaming Institute supplies independent benchmarks that users can load into their tracking dashboards for comparison purposes. These additional reference points help distinguish between typical mathematical variance and potential discrepancies in reported game parameters.
Conclusion
Tracking applications continue to refine methods for presenting slot hit rates and drought lengths by combining large-scale session data with established regulatory and academic benchmarks. The resulting reports give players and researchers structured views of frequency patterns and dry spell durations across diverse game libraries without relying on anecdotal observation alone.