Weather Variables and Their Statistical Ties to Outcomes in Elite Horse Racing Events
Written by Mia Perry · Jul 23, 2026
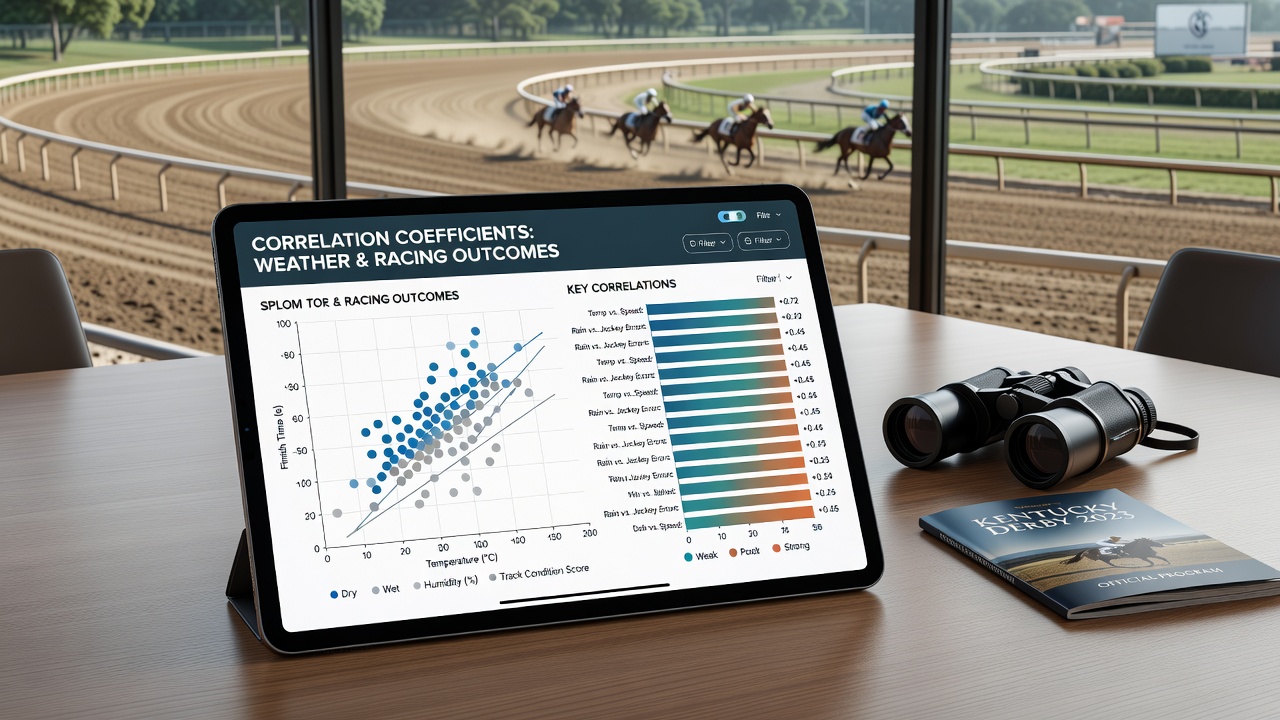
Weather Variables and Their Statistical Ties to Outcomes in Elite Horse Racing Events
Analysts have long tracked how temperature shifts, rainfall totals, and wind speeds align with finishing times, favorite win rates, and overall field performance across marquee fixtures, yet the precise correlation coefficients remain a focal point for data teams working with large historical sets. Studies compiled through 2025 and into July 2026 continue to refine these relationships using Pearson and Spearman methods on datasets that span multiple decades of race records paired with on-site meteorological readings.
Core Variables Under Examination
Temperature stands out as one of the most consistently measured factors, with researchers noting moderate negative correlations between rising heat and average race times in events exceeding 1,600 meters, while cooler conditions in the 10-15°C range often coincide with faster overall splits. Precipitation introduces another layer, because ground conditions change rapidly when rainfall accumulates above 5 mm in the 24 hours before post time, and data from several European and North American tracks show that soft or heavy going correlates with longer finishing times for speed-oriented runners yet sometimes favors stamina horses.
Wind speed and direction add directional effects that vary by track layout, since headwinds on the home straight tend to produce stronger negative correlations with sprint outcomes whereas crosswinds can disrupt balance in tighter turns. Humidity levels, although less frequently isolated, appear in combined models where high moisture paired with warmth shows slight positive associations with slower times across middle-distance races.
Statistical Approaches and Recent Findings
Multiple regression models that incorporate these variables alongside horse-specific factors such as age, recent form, and trainer statistics produce R-squared values that range from 0.18 to 0.34 depending on the dataset size and the particular meeting examined. One analysis covering 12 years of Australian Group 1 results reported a Pearson coefficient of -0.42 between pre-race temperature and winning time on turf, while a separate Canadian study of Woodbine track data found weaker but still significant links between wind gusts above 25 km/h and variance in place-getting percentages.
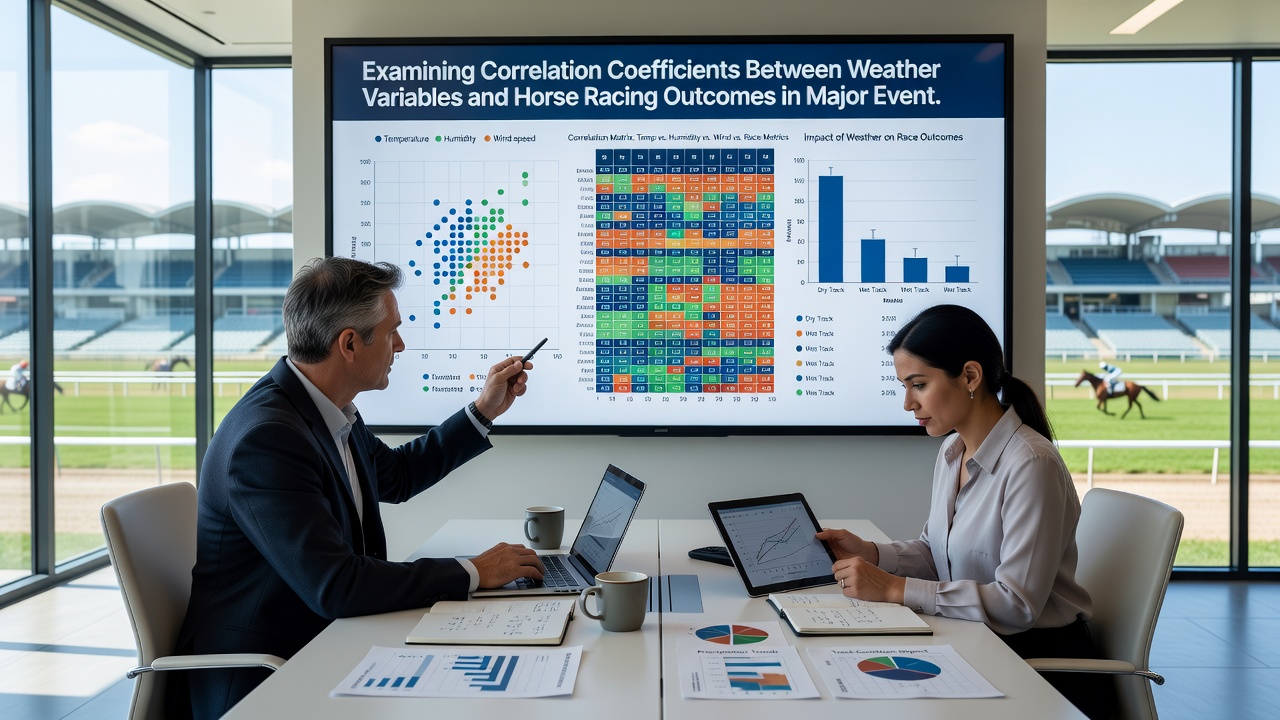
Observers note that machine-learning ensembles now supplement traditional coefficient calculations, allowing non-linear interactions to surface that linear models sometimes miss. Data released in early 2026 from a collaborative project involving the University of Melbourne and Racing Australia indicates that rainfall thresholds interact with track rating in ways that shift favorite success rates by as much as 6-9 percentage points when conditions move from good to soft. Similar patterns surface in US records from Churchill Downs, where July heatwaves have historically aligned with measurable drops in performance for European imports unaccustomed to higher humidity.
Regional Differences Across Major Meetings
European festivals such as Royal Ascot and the Prix de l'Arc de Triomphe display distinct signatures compared with Australian carnivals or Kentucky Derby weekend, because soil composition, drainage systems, and typical weather patterns differ markedly. In Ireland, where persistent drizzle is common, studies from the Irish Equine Centre have documented smaller correlation magnitudes overall, suggesting that local horses adapt more readily and therefore weather exerts a dampened statistical effect. Conversely, arid tracks in parts of Australia and the Middle East show stronger coefficients when sudden temperature spikes occur, with one dataset from the Dubai World Cup meeting series revealing that each additional degree above 35°C associates with roughly 0.8 seconds slower average times over 2,000 meters.
Those who maintain longitudinal databases emphasize that sample size and variable collinearity require careful handling, because temperature and humidity often move together, which can inflate standard errors if not addressed through variance inflation checks. Updates through July 2026 continue to incorporate real-time sensors at more venues, improving the granularity of precipitation and wind readings that feed into these models.
Practical Applications in Performance Forecasting
Trainers and analysts apply these coefficients when assessing horses with known preferences for firm versus yielding ground, while handicappers integrate meteorological forecasts issued 48-72 hours before race day to adjust expected pace scenarios. International governing bodies such as the International Federation of Horseracing Authorities have begun referencing aggregated weather-performance datasets in their annual reports, and academic groups at institutions in Australia and Canada publish periodic updates that allow practitioners to benchmark their own internal models against broader findings.
One case involving the Melbourne Cup illustrates how a late rainfall event shifted correlations: conditions that moved from good to soft produced a measurable uptick in longer-priced runners finishing in the first four, consistent with historical coefficients observed across prior wet renewals. Parallel observations from the Breeders' Cup at Santa Anita have shown that daytime temperature drops of more than 8°C between morning and afternoon card sessions align with changes in speed figures for certain distance categories.
Conclusion
Continued refinement of correlation coefficients between weather variables and horse racing outcomes rests on expanding datasets, improved sensor coverage, and cross-regional collaboration that accounts for local adaptations. Figures released through mid-2026 underscore that while individual coefficients rarely exceed moderate strength, their combined explanatory power grows when models incorporate interactions among temperature, rainfall, wind, and track condition. Observers tracking these patterns expect further precision as more venues adopt standardized meteorological logging protocols, allowing consistent comparisons across the global calendar of elite events.